HamPoll: Hamilton's Polling Organization, a student group at Hamilton College, uses online surveys to provide accurate and useful information about the preferences and opinions of the Hamilton community.

Monday, April 5, 2010

Results for HamPoll Questions on Gender Neutral Housing

By Kye Lippold, HamPoll Co-Chair

From February 25th to March 1st, 2010, the student survey group HamPoll posed a number of questions about gender neutral housing at Hamilton College to students who responded to a survey about Departments and Majors. The results suggest a majority of the student body favors gender neutral housing, which the survey specified as “a housing arrangement in which students of different genders would be allowed to share a room.”

Familiarity with Gender Neutral Housing

A majority of respondents expressed familiarity with gender neutral housing, as can be seen in the following chart.


Support for Gender Neutral Housing

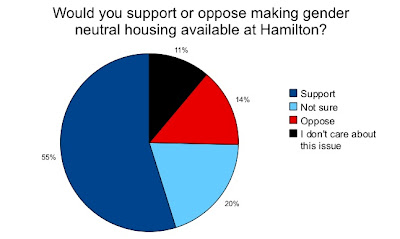
277 students supported making gender neutral housing available at Hamilton, a slim majority of the sample (55%, shown in the following chart). However, only 14% (59 students) were opposed, with the remaining 31% unsure or expressing disinterest.


To further analyze support for gender neutral housing, HamPoll constructed a statistical model that examined how support for gender neutral housing varied as a function of demographic factors. The model revealed that gay, lesbian, and bisexual students were 35% more likely than straight students to support gender neutral housing, while liberal students were 14% more likely to support the idea than moderates or conservatives. Support for gender neutral housing also increased with self-identified familiarity with the issue, with students who were “very familiar” with gender neutral housing being 41% more likely and those “somewhat familiar” 24% more likely to support the issue than those who were less familiar. These results control for sex, class year, race, Greek society membership, financial aid status, varsity sport membership, grades (A student versus non-A student), place of residence (from New York State or not) and attending public or private high school; students from all these groups showed no significant differences in responses.

Types of Gender Neutral Housing Preferred

HamPoll sought to more closely examine the type of gender neutral housing policy that students favored by asking students to pick which of the following options they preferred more: “Allowing students of different genders to share a room anywhere on campus” or “Allowing students of different genders to share a room in specific dorms, similar to current substance-free housing policies.” Overall, 35% of respondents favored the first (all-campus) option; 41% favored limiting gender neutral housing to specific dorms; 15% were not sure; and 9% did not care about the issue.

Notably, among the subset of students who supported a gender neutral housing policy (227 students, or 55% of the sample), 55% (125 students) supported making gender neutral housing available across campus, while 38% (86 students) supported gender neutral housing in certain dorms. While this represented a stronger preference for the entire-campus option among gender neutral housing supporters than among non-supporters, these results suggest some divisions regarding how supporters thought a gender neutral housing policy should best be implemented.

When controlling for demographic variables and familiarity with the issue, men were 12% more likely than women to support an all-campus policy, while juniors were 14% less likely than other class years to support a broad-based implementation. Other demographic variables did not lead to significant differences in preferences for one policy or the other.

Characteristics of the Survey Sample

The survey received 414 valid responses, representing about one-quarter of the student body. The survey sample was self-selected, so results may differ from the overall population; notably, the sample contained a higher proportion of women and white students and fewer varsity athletes and Mid-Atlantic residents than the Hamilton student body in general. However, this pattern of results is largely consistent with previous HamPoll surveys, implying that interest in particular topics on this survey did not strongly skew responses towards one subgroup.


Demographic Group Percentage of Students in Survey Sample Percentage of Students at Hamilton*
Female students 64 52
Male students 35 48
Students of color 14.7 16.5
White students 81.1 70.4
Financial aid recipients 50 50
Students without aid 45 50
Varsity athletes 18 About 35-40
Mid-Atlantic residents 42 48
New England residents 28 29
International students 4.8 6.2


*Demographics drawn from Hamilton Admissions website (data for 2008-9).
Note: percentages may not add to 100% due to exclusion of “Prefer not to answer” and “Other” responses.


Conclusions

A majority of Hamilton students favored gender neutral housing in HamPoll's survey, with students who were more familiar with the issue expressing more support. However, students were divided on whether to implement such a policy across campus or in specific residence halls.

Questions about methodology or data may be directed to Kye Lippold or David Foster, HamPoll Co-Chairs, at hampoll@hamilton.edu.

Thursday, March 4, 2010

Hookups and Long-Distance Relationships Prevalent at Hamilton

By Kye Lippold, HamPoll Co-Chair

A survey conducted in mid-February by HamPoll offers a unique perspective into the details of the dating scene at Hamilton. Among the primary findings were that students widely believed that short-term relationships were easier to attain than long-term relationships, and that 18% of Hamilton students were in long-distance relationships.

Many students reported a culture conducive to hookups over long-term relationships; among students who had an opinion about both relationship types, 70% of students said it was difficult to find new long-term relationship partners at Hamilton but easy to find short-term partners. However, 61% of students said they would prefer to settle down with one person during their college years rather than  “play the field” (17% preferred the latter, with 21% not sure).  There was no gender difference on this question, with all demographic groups about equally likely to prefer settling down with one person (except for seniors, who were 17% more likely to prefer to play the field).

A lack of romantic opportunities could be a factor in Hamilton students' difficulty finding partners; 54% of students thought there were not enough events on campus where couples could go on dates, versus 20% who thought there were enough opportunities. However, dating at Hamilton was relatively infrequent, with 31% of dating students not in long-distance relationships reporting going on dates with their partner once per week or more, 29% going on dates a few times per month and 38% going out a few times per semester or less often.

43% of respondents reported being in a relationship, with 51% of dating students having been in their relationship for one year or longer and 70% of them having met their current partner at Hamilton. Half of all dating students reported knowing their partner for less than three months before going out, while the other half knew their partner for a longer period prior to dating. On the other end of the spectrum, 10% of the sample reported never having been in a relationship. When asked why they were not currently in a relationship, only 12% of single students reported that they were not interested in a relationship; the most common response was being unable to “find the right person,” with 38% of respondents offering this reason.

Groups more likely to be in relationships included students in Greek societies (13% more likely than non-Greek students), “A” students (9% more likely than students with lower grades), Darkside students (13% more likely than Lightsiders), students who thought intelligence was “very important” in a partner (10% more likely than those valuing intelligence less), and students who had been in at least two relationships in their lives (19% more likely than those with less experience). Men who identified as gay or bisexual were less likely than other students to say they were in relationships (32% less likely on average), while students who preferred to play the field rather than settle down with one person were 15% less likely to be dating.

Fully 42% of those in relationships (18% of the entire sample) reported that their relationship was long-distance, a substantial subgroup. Students on varsity sports teams were 18% more likely to be in long-distance pairings when controlling for other factors, while students who met their partner at Hamilton were 75% less likely.

Students in relationships reported spending a median of 2.5 hours per day with their partner, with substantial variation (90% of students reported spending from less than one to six hours per day). Students in long-distance relationships spent only about one fewer hour per day with their partner than those not in long-distance relationships, while those dating someone they met at Hamilton spent one hour per day more. Grayside students spent about an hour more with their partners than Lightsiders or Darksiders, as did students who found physical appearance very important when choosing a partner. Those who preferred to “play the field” spent 1.2 fewer hours per day with their partners on average.

The survey received 546 responses, for about a 31 percent response rate. Women and white students were overrepresented in the survey sample, while students on financial aid and international students were underrepresented; however, this pattern was consistent with previous HamPoll surveys, suggesting selection bias related to the survey topic may have been a relatively minor issue.

Thursday, February 18, 2010

Media Outreach

As our readers may notice, we have recently added a Facebook Page and a Twitter feed to streamline our process of providing updates about survey results. We welcome everyone to follow us on Twitter or become our fan on Facebook by using our widgets to the right.

Thursday, February 4, 2010

Hamilton students divided over Great Names and printing; oppose ice rink

By David Foster '10, Kye Lippold '10, and HamPoll Staff

The latest HamPoll student survey shows that a plurality of respondents, 45 percent, would prefer that Hamilton host a second-tier Great Names speaker this semester, while only 35 percent favor canceling the lecture and using the money next year as outlined in the plan announced by the administration. While varsity athletes and A students were willing to wait, 65 percent of seniors called for a speaker this semester. This result reflects many seniors' concerns about losing an important part of their Hamilton experience without a Great Names lecture in their final year; as one senior put it in a comment to the survey, “seniors are missing out entirely as a result of the recent decision.” Several students also expressed regret at the lack of a speaker when the program is, as one student put it, “one that Hamilton advertises as one of its most attractive functions.”

The HamPoll survey allowed respondents to write in a response to the question of what the college should do about the Great Names lecture; 6.4 percent of students wrote in an answer, with the results summarized in the accompanying chart.
Students also expressed their opinions about what types of speakers they would like to see in a Great Names lecture. Comedy and politics led the list with support from about 75 percent of respondents, followed by theatre or film, music, and literature (with only 20 percent expressing interest in religion). Additionally, 56 percent of respondents indicated that the speaker's fame was important or very important in deciding whether to attend the lecture. Controlling for various demographic factors suggests that seniors were much less likely to express interest in fame, again likely due to concerns about having a speaker at all.

The survey also asked students their opinions about some other contentious issues on campus. Students were divided on the new print management program, with 43 percent calling it reasonable and 54 percent calling it unreasonable. However, most students wanted printing prices charged after exceeding the quota to be set lower than the current proposal of 15 cents, with 22 percent calling for 10 cents, 54 percent for 5 cents, and 14 percent writing in a request for no charge whatsoever.

Regarding the outdoor ice rink in the Dunham Quad, fully 90 percent of respondents thought the rink was a bad use of Student Assembly funds. Out of the 500 respondents, 7 students (1.4 percent) said they had used the rink, while 56 (11.2 percent) intended to use it and 87 percent of students had no intention of using the rink.

The survey received 500 responses, for about a 29 percent response rate. The sample over-represented white students and women relative to the overall Hamilton population, while most other demographics were comparable.

Tuesday, January 19, 2010

Hamilton Students Closely Follow Spectator and Duel Observer

By Kye Lippold, HamPoll Co-Chair

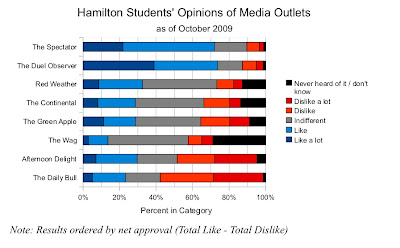
A survey conducted in early October 2009 by HamPoll found that the Spectator and Duel Observer were the most popular Hamilton publications, while the Daily Bull and the (now defunct) Afternoon Delight brought up the rear of students' acclaim.


We further analyzed the data by breaking down responses among demographic categories (specifically: gender, race, financial aid status, class year, location of hometown, living on the darkside or lightside, playing sports, being in a Greek society, and political leanings). The following groups of students were especially likely to read each publication (reading “most issues” or more) relative to other groups in each category:

• The Spectator was read most often by students in Greek societies (77% of Greeks read the Spec often, versus 58% of non-Greeks), and students from the Northeast (66% of local students versus 50% of others). Students on financial aid were less likely to read the Spectator (57%) than students without aid (65%).
• The Daily Bull was especially popular among Darksiders (37% frequent readers, versus 26% of others).
• Senior students were less likely to often read the Duel Observer (only 52%) than those in earlier class years (70%). The Duel was also slightly less popular among students of color (61%) than among white students (69%).
• Students in Greek societies were more likely to read the Continental (47% versus 32%). Firstyears and sophomores were less likely to read this publication (likely influenced by the fact that the survey was fielded before the Continental released that semester's issue).
• The Green Apple was not read often by any group; only liberals were marginally more likely to read it than moderate or conservative students, 26% versus 14%.
• Afternoon Delight was not much read by students of color, only 16% of whom read it often (versus 34% of white students).
• Red Weather was more popular among students on financial aid, 24% versus 14%.
• The Wag was the least read publication on campus, only read by 11% of students. This number was probably further decreased because the Wag had not published when this survey was fielded.

The survey received 411 responses, or about a 23 percent response rate. The survey sample was self-selected, so results may differ from the overall population; notably, women, white students, and non-athletes were overrepresented in our sample, although the sample very closely matched Hamilton student demographics in terms of geographic distribution.

Supplemental Graph

Thursday, December 10, 2009

Preliminary Results from HamPoll's Survey on Campus Climate

By Kye Lippold and HamPoll Staff

From November 19th to 23rd, 2009, the student group HamPoll conducted an online survey of student opinions about bias incidents on campus, sex education, and issues related to campus climate and values. We present results for the questions related to campus climate in this report.

The survey was submitted to all students by email, and received 422 responses, or about a 25% response rate. The demographics of the survey sample are relatively close to the demographics of the Hamilton student body, as indicated in the chart below:


Thus, the sample underrepresented male students, varsity athletes, and Mid-Atlantic residents, while over-representing white students and female students. Residents from other geographic areas were appropriately represented, and responses were almost evenly split by class year.

I. Feelings on Hamilton as a Welcoming Environment
We asked students about their opinions on whether Hamilton was a environment that was welcoming to them personally and to various social groups. The results, presented below, suggest students viewed students of color, low-income students, and gay or lesbian students as less welcome on campus than others.

II. Views on Shared Values
We asked students about a list of values that might be seen as widely shared at Hamilton. Students were asked about both how widespread they thought those values were among members of the Hamilton community, and to what extent they personally agreed with those values. The results suggest that in most cases students perceived the listed values as less widespread than they actually were among the sample—implying that students underestimated those values' actual prevalence. The notable exception was views on underage drinking, which were assumed to be more universally held than they were by this sample.

The questions:
Members of the Hamilton community have different opinions about which values are widely shared by the community. Please indicate which of the following values you believe are widely agreed upon at Hamilton, regardless of whether or not you personally agree with those values. 
and
Do you personally agree or disagree with the following values? 

The values we asked about were as follows:
• Drinking alcohol before the age of 21 is acceptable
• Work should always come first, even if it means less spare time
• Having an open curriculum is a better choice than stricter distribution requirements
• Physical education is an important component of the academic program
• Violating the Honor Code is never justified
• Hamilton should attempt to minimize its impact on the environment
• Professors and student groups should be free to bring controversial speakers to campus
• Ethnic diversity enriches the intellectual life of the College
• Students should govern themselves to the greatest extent feasible
• It is important for students to contribute to the local community


III. Views on Shared Experiences
Hamilton students were close to evenly divided on the question of whether Hamilton offered too few or enough shared experiences, although less than 1% of the sample thought there were too many such events.

The question: Some people think Hamilton offers too few experiences that are shared by the whole community, while others say Hamilton students are bonded by experiences like orientation, Class and Charter Day, and FebFest. Which comes closer to your view?

Sunday, November 15, 2009

Hamilton Students Worried about Swine Flu, Uncertain about Health Center's Response

By Bret Turner '13, Kye Lippold '10 and HamPoll Staff

A recent survey conducted by HamPoll showed swine flu significantly impacted campus life among both those who contracted the virus and those who stayed healthy. Overall, 23% of respondents said they had experienced flu-like symptoms that were diagnosed officially or that they suspected to be swine flu; of those who responded as sick, 42% did not visit the Health Center. Among students who stayed healthy, 53% were very or somewhat worried that they would come down with swine flu in the future. 39% of the total sample supported mandatory isolation of students who are sick, though only 25% of sick students supported such a measure.

A majority of respondents felt the administration had done enough in response to the outbreak (50% agreed, whereas 26% felt it hadn’t), and 64% said the administration was quick enough in providing information. The Health Center fared somewhat worse (31% approval, 39% disapproval), with many students offering strong criticism of their experiences there; as one student commented, “many people I know were refused appointments and some were forced to go the the emergency room because the Health Center could not make appropriate accommodations.” Fully 30% of sick students said the Center had done a bad job in the areas of diagnosis, prompt appointments, and adequate care. However, about a quarter of students thought the Health Center had done a good job in these areas; one student argued “they were just overrun by this swine flu thing.”The Health Center was most highly praised for its prevention information, with 56% of well students and 49% of sick students feeling it had done a good job.

The overwhelming majority of students changed their daily behavior in some way as a result of the outbreak. Among those not sick, the most common actions were washing hands more (78% of respondents) and using hand sanitizer (71%), while fully 34% of healthy respondents avoided social events. Common counter-measures undertaken by sick students included sleeping more (92%), missing class (86%), taking over-the-counter medications (80%), and avoiding social events (73%). Only 14% of sick students made use of the bagged meals program offered by Bon Appetit.

There was no substantial difference in the distribution of reported swine flu cases among different dormitories, students who had single rooms, or varsity athletes. Only 34 students (6%) admitted to having pretended or exaggerated illness to excuse themselves from class or a deadline.

The survey garnered 576 responses, for about a 33% percent response rate. The sample over-represented white students and women, while under-representing students from the Mid-Atlantic, varsity athletes, and students on financial aid.